Management Insights dashboard
Use the Management Insights dashboard to view data in several categories and in a page designed for chief financial officers (CFO) and other executives and financial officers. Each of these pages offer Axiom Intelligence tools for filtering the view. Tabs are available at the bottom of the dashboard to view additional pages in the dashboard.
Click image to view full size
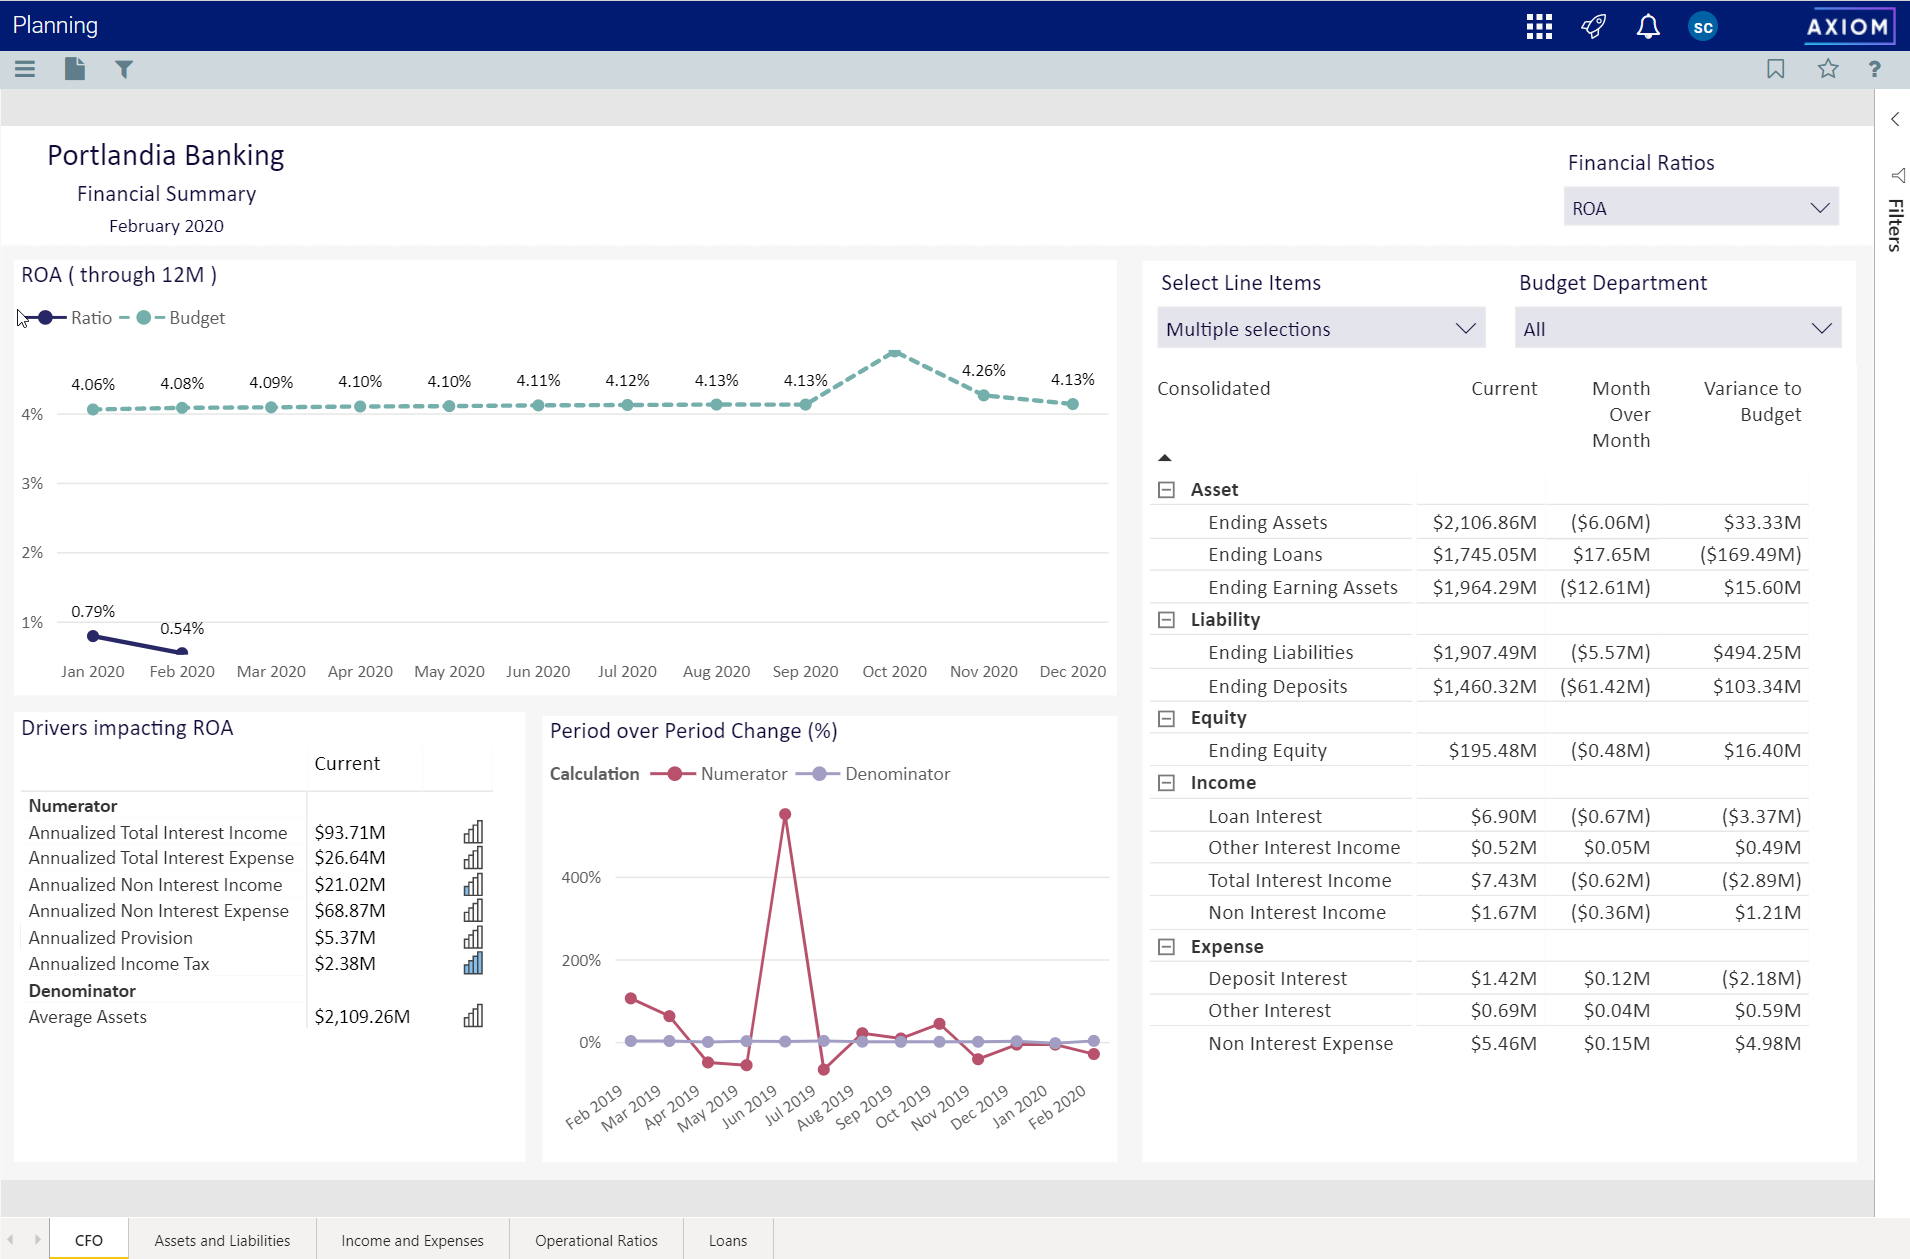
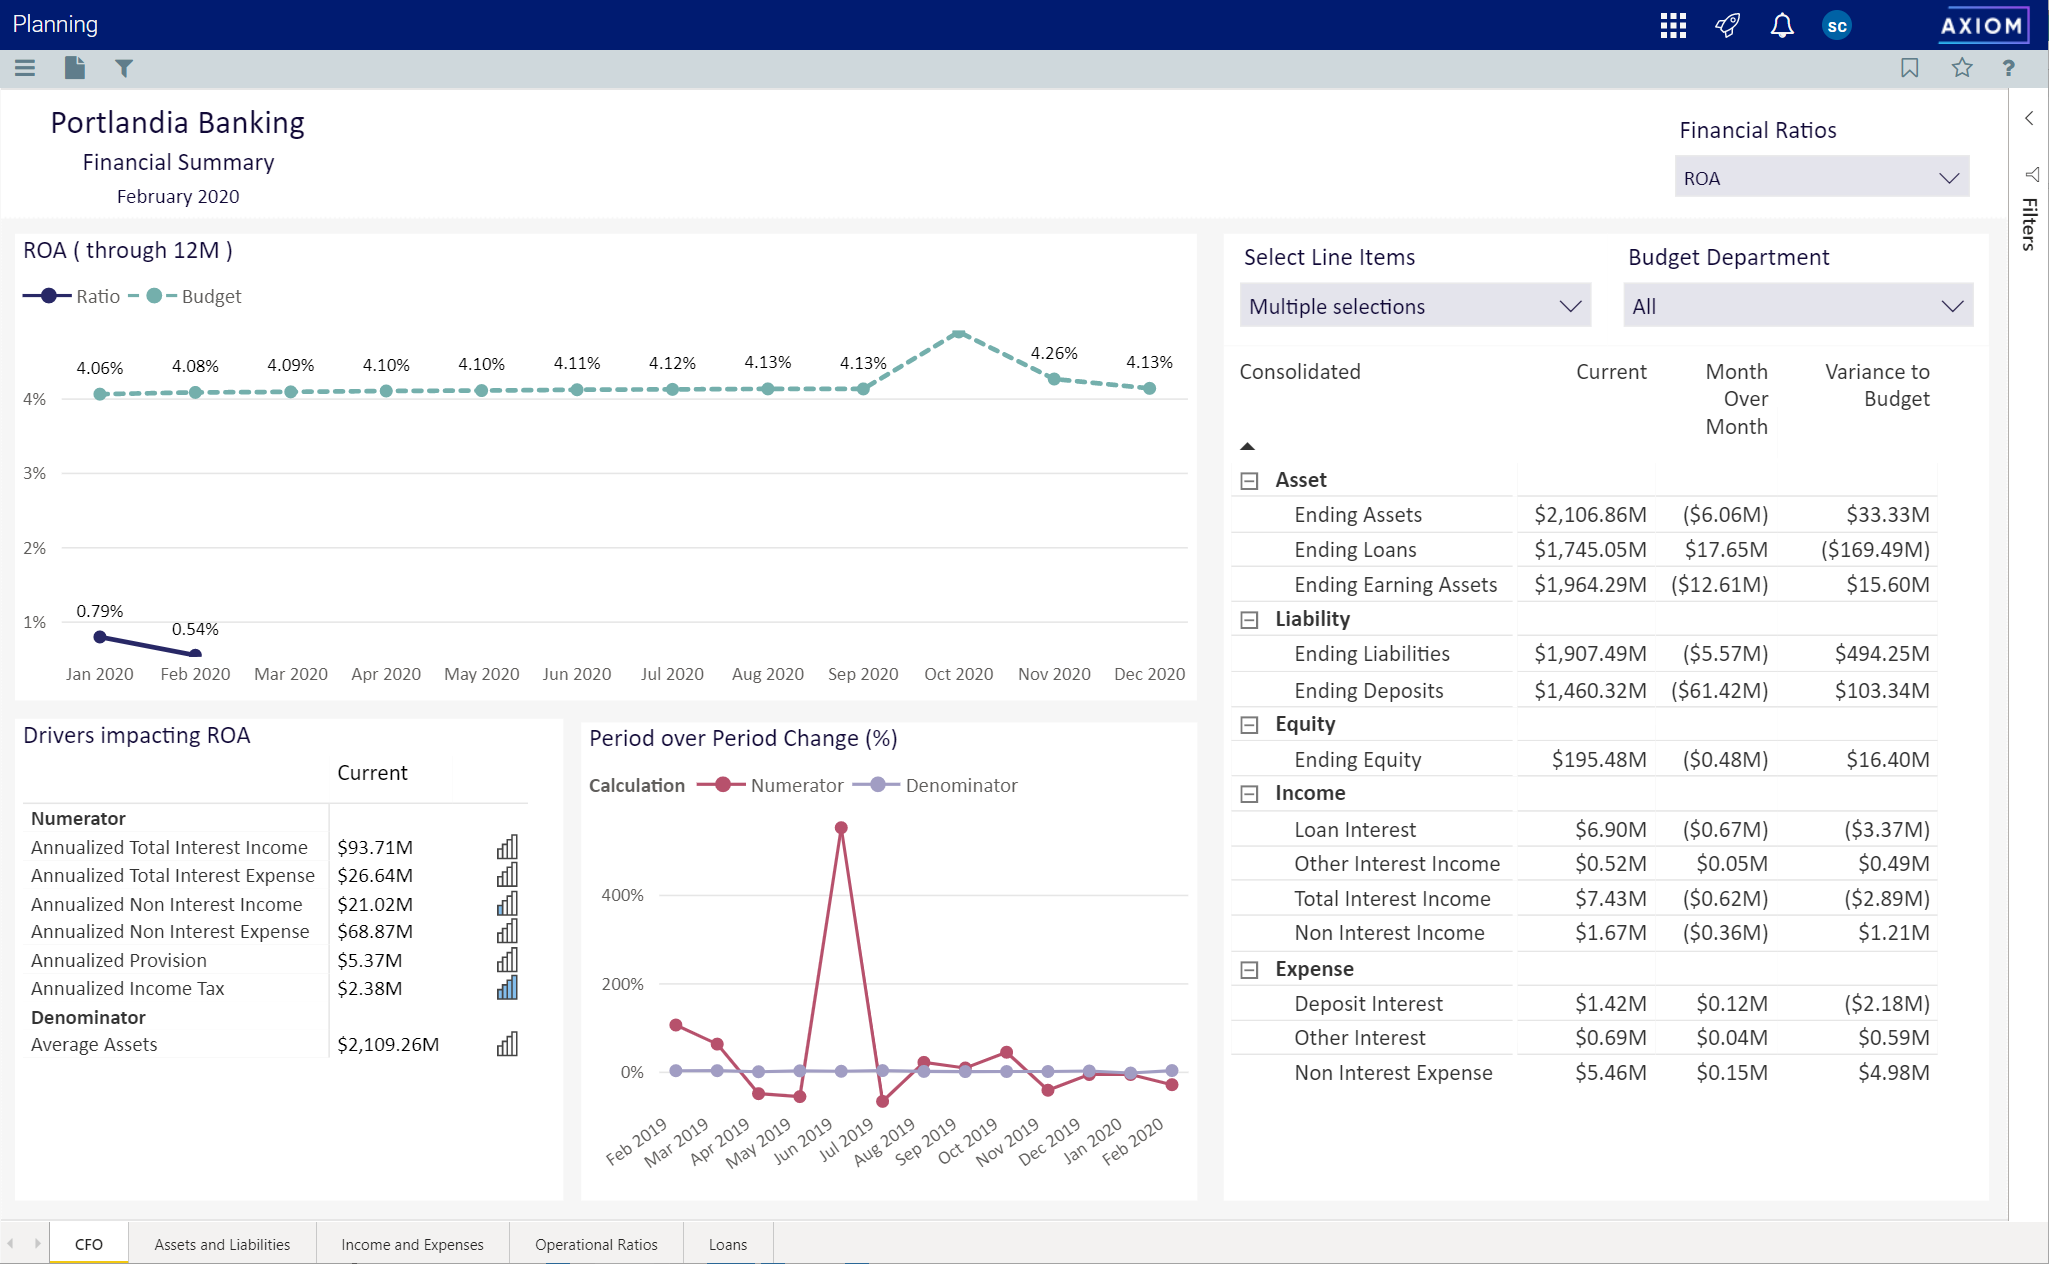
CFO page
This page offers a financial summary designed for the Chief Financial Officer.
Click image to view full size
The initial view of the page displays:
-
All asset, liability, and equity data for all types
-
All budget categories
-
Financial ratio of Return on Assets (ROA)
Each of these can be changed to tailor the financial summary view.
Use the Financial Ratios drop-down menu to select one of the financial ratios. They include ROE, funding and efficiency ratios, ratios for loans, equity, and assets, and many more.
Select Line Items lets you work with the major categories of all Assets, Liabilities, and Equity. You can also work with selected items for one of the major categories.
Budget Department lets you choose any, some, or all of the budget departments available.
When you make any of these changes to the dashboard, it redisplays immediately with new visualizations of the data.
You can also select individual items inside some visualizations. For example, you can select any numerator in the Drivers visualization to focus on just that item.
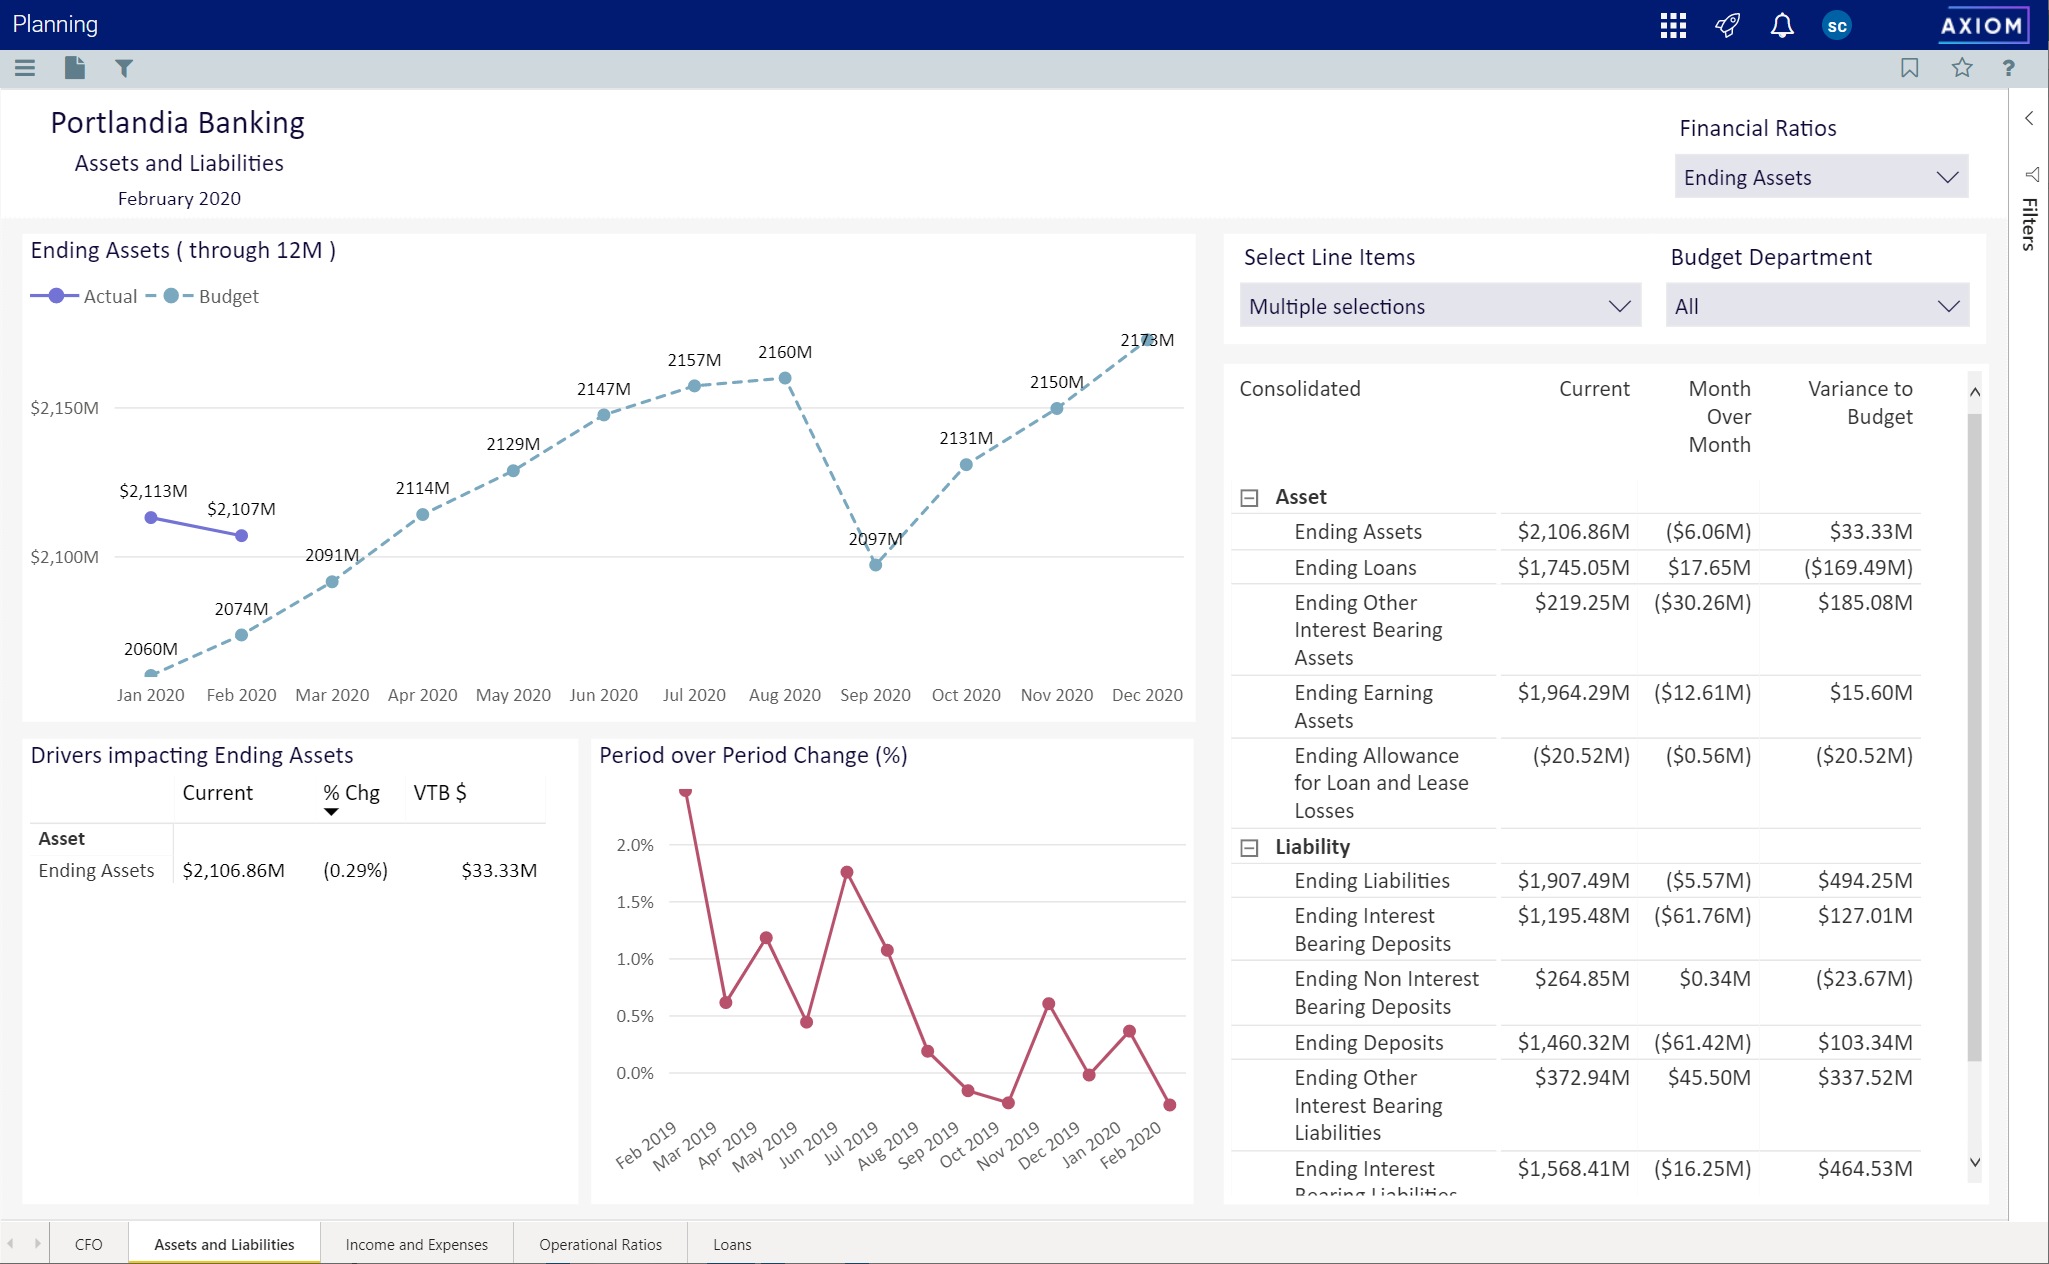
Assets and Liabilities page
This page examines assets and liability data in more detail. The page includes visualizations for Ending Assets, Drivers, and Period over Period Change. It also includes a list that displays the figures for the assets or liabilities you are viewing.
Click image to view full size
When the page opens, you see data for all assets using the Financial Ratio of Ending Assets. Use the Financial Ratios drop-down to select other asset ratios, such as Ending Liabilities or Ending Equity. When you choose a ratio, the page redisplays with data matching the new ratio.
Use the Budget Department drop-down to select one of your institution's budgets to work with.
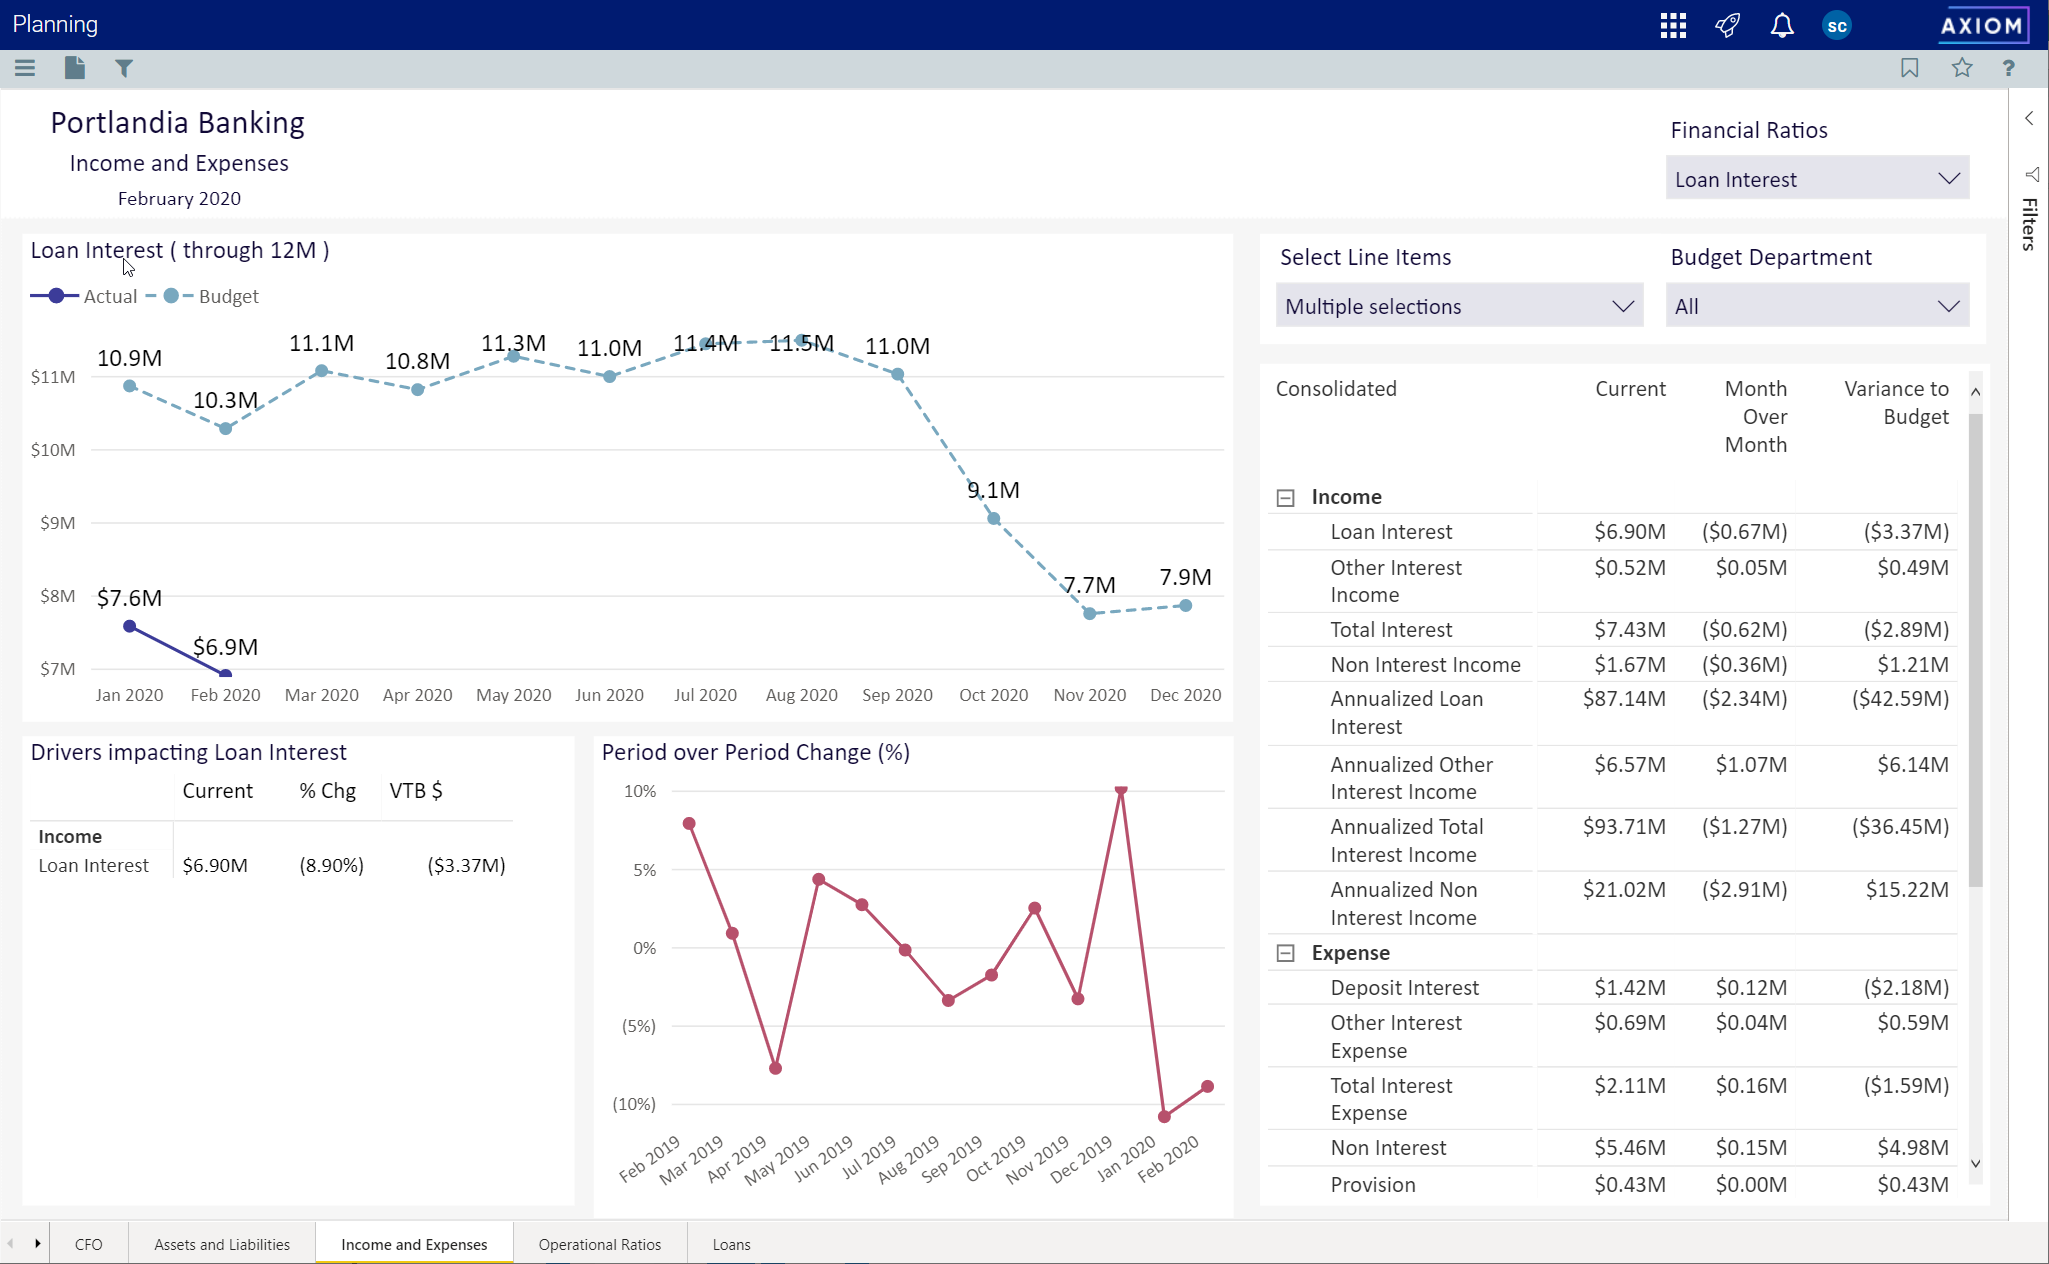
Income and Expenses page
This page examines incomes and expenses for a budget. Incomes include interest and non-interest income. Expenses includes deposit interest, interest and non-interest expense, and income tax.
Click image to view full size
This page contains visualizations for the chosen financial ratio, drivers affecting that ratio, and period over period change. A list of all income and expense categories are included, with current, month over month, and variance to budget dollar amounts.
Use the Financial Ratios drop-down menu to select any on of the income or expense categories to view visualizations of those ratios.
Use the Budget Department drop-down menu to view one, some, or all of the available budget departments. When the page opens, all budget departments are selected.
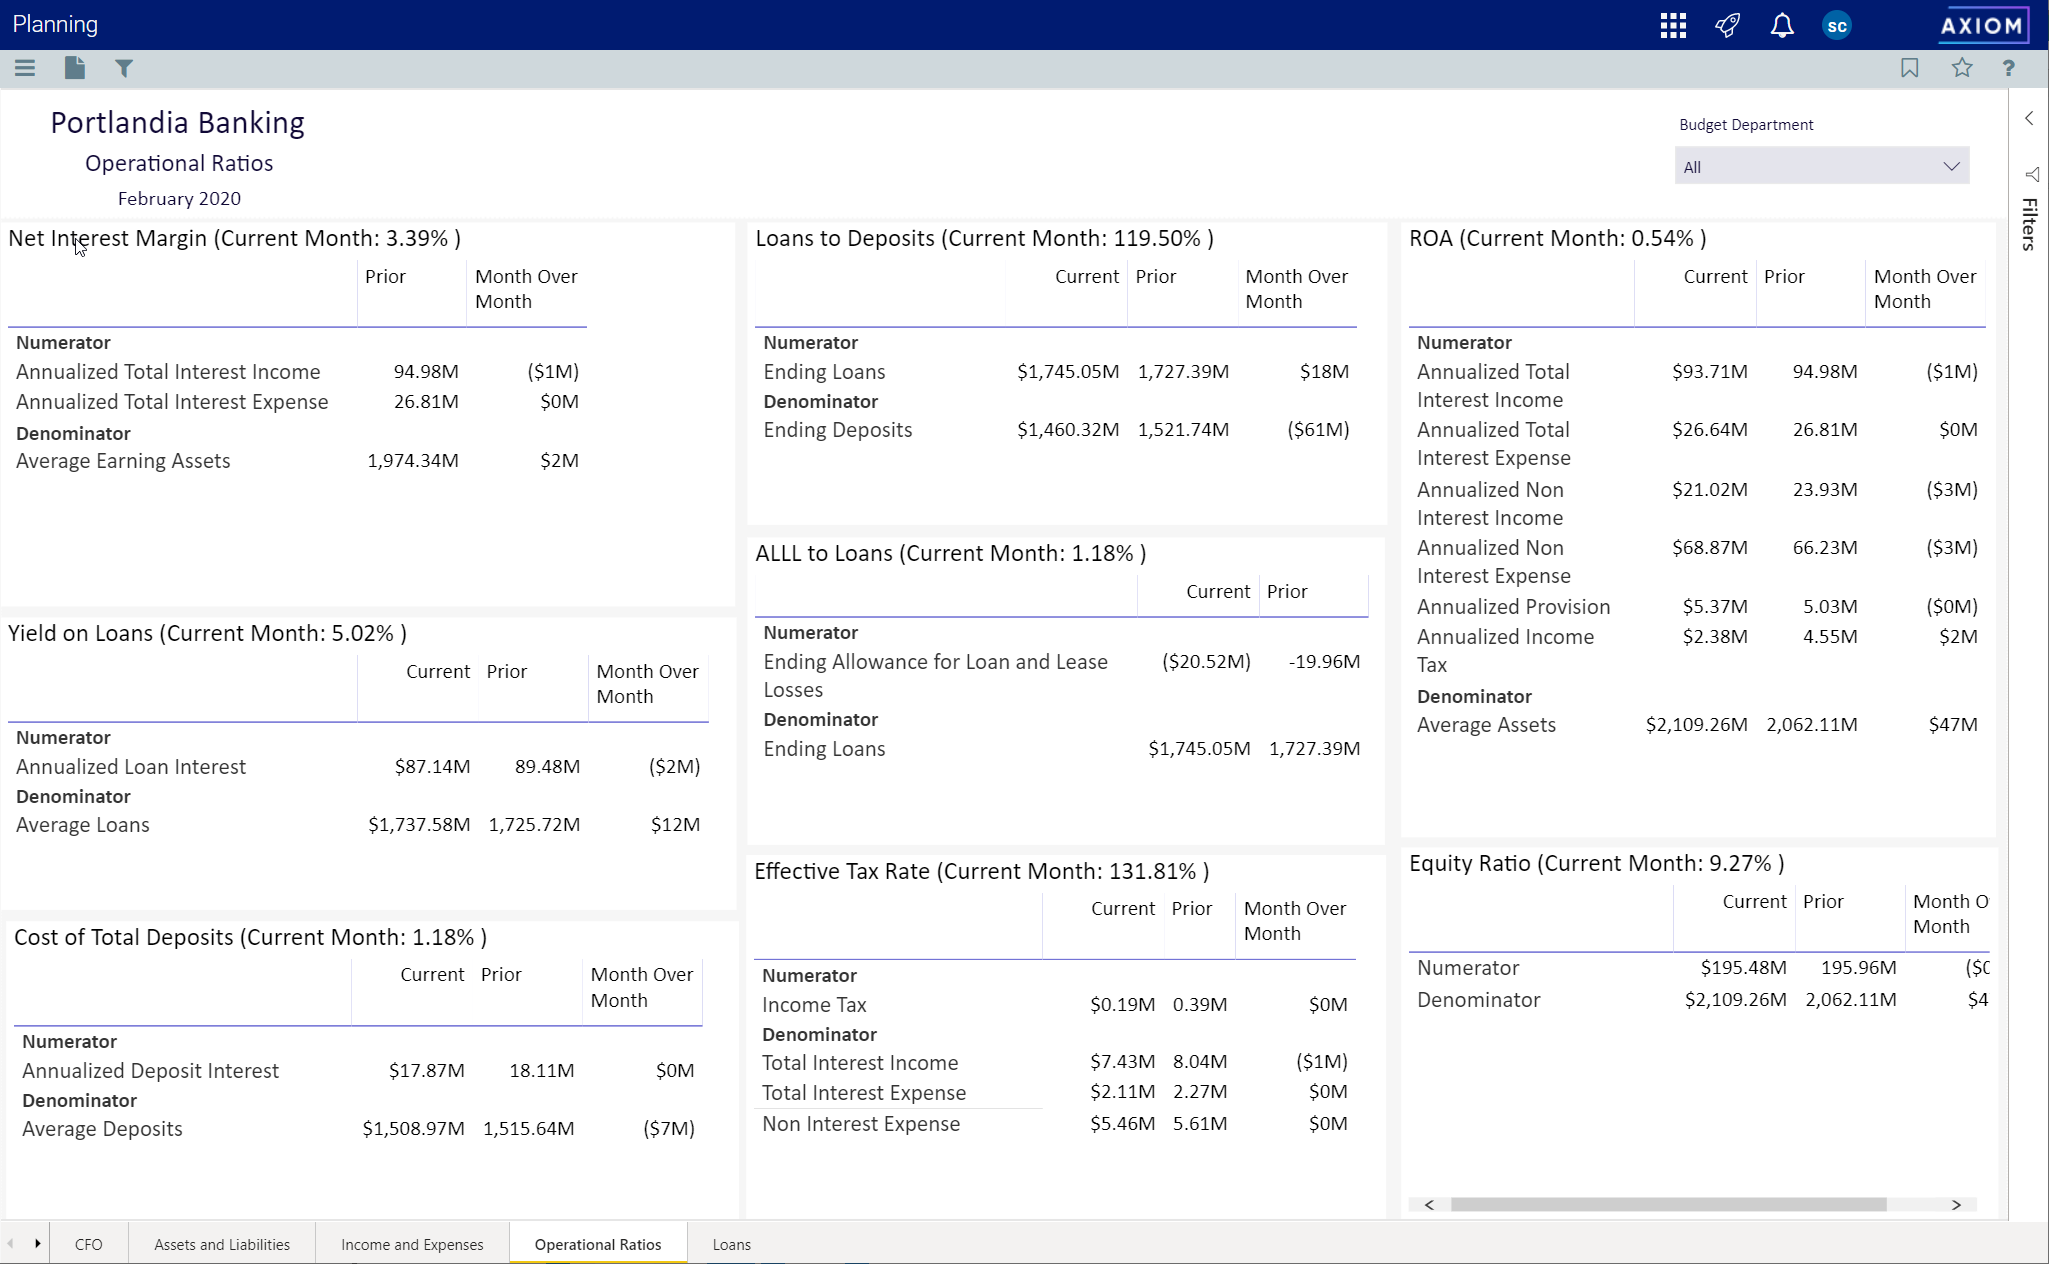
Operational Ratios page
This page includes ratios for Net Interest Margin, Yield on Loans, Cost of Total Deposits, Loans to Deposits, ALLL to Loans, Effective Tax Rate, Return on Assets (ROA), and Equity Ratios.
Click image to view full size
Use the Budget Department drop-down menu to view one, some, or all of the available budget departments. When the page opens, all budget departments are selected.
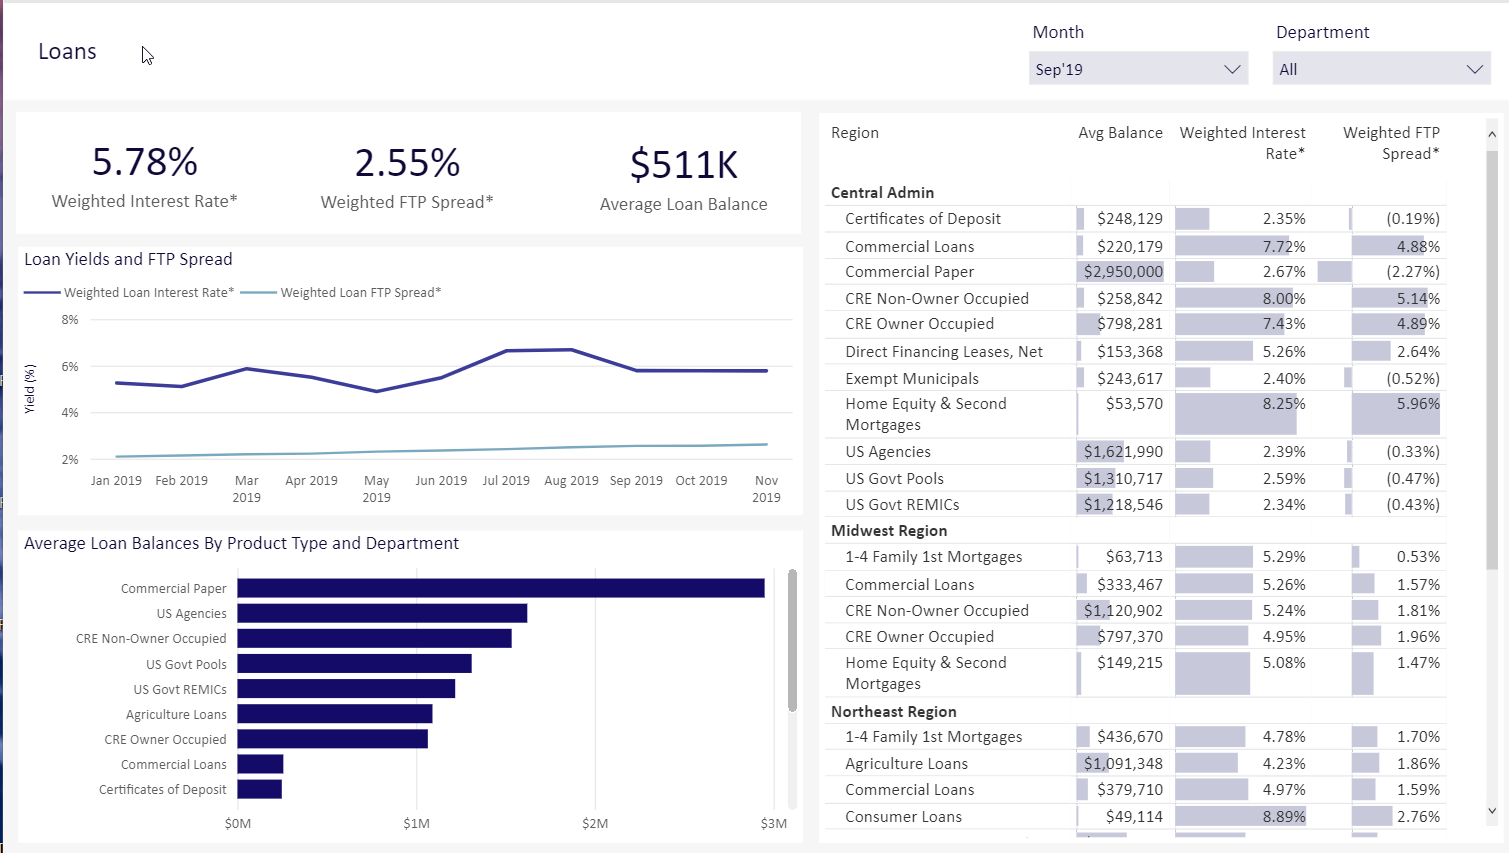
Loans tab
This page provides loan visualizations for a month that you select. When the page opens, loan data for all available months is used. The data selection default setting is all months.
Click image to view full size
The visualizations include a card with a weighted interest rate, weighted FTP spread and average loan balance; loan balance and FTP spread; average loan balances by product types and department, and a list of loan data by region.
Use the Month drop-down to select a month to view data for. Use the Department drop-down to select a department to view data for.
